


.png)


Ever stood in the grocery store aisle, staring blankly at shelves of pasta sauce, unsure which one to pick? Too many choices can feel overwhelming. Funny enough, investing often feels the same way.
We have thousands of stocks at our fingertips, each with its own story, promise, and risk. How do you choose without getting a headache?
Let’s talk about a tool that can help simplify this conundrum: K-Means Clustering. But don’t let the fancy name scare you off. It’s like organizing your messy garage — but for stocks.
The Paradox of Choice in Investing
Remember when there were just a few channels on TV? Now, with hundreds of options, finding something to watch can take longer than the show itself. In investing, more choices don’t always make things easier or better.
We often believe that more information leads to better decisions. But sometimes, it just leads to analysis paralysis.
Grouping Stocks Like Sorting Socks
Imagine dumping a laundry basket full of socks on your bed. They’re all mixed up — different colors, patterns, sizes. The quickest way to sort them? Group similar ones together.
That’s essentially what K-Means Clustering does with stocks. It groups companies that share similar characteristics — like historical returns and volatility — so you can make sense of the scene.
Why Clustering Matters
When we group stocks:
- Diversification Becomes Manageable: Instead of picking randomly, you can choose stocks from different groups, reducing the risk of them all sinking at once.
- Spotting the Outliers: Ever notice one sock that doesn’t match any other? In finance, that might be an undervalued stock waiting for attention.
- Simplifying Decisions: Fewer groups mean fewer choices, making the investing process more manageable.
A Simple Guide to Clustering Stocks with Python
Now, I’m not assuming you’re a programming pro. But stick with me — this is easier than assembling that DIY furniture you bought last month.
Step 1: Gather Your Tools
You’ll need Python and a few libraries.
import pandas as pd
import numpy as np
from sklearn.cluster import KMeans
import matplotlib.pyplot as plt
import yfinance as yf
Step 2: Get the Data
Imagine you’re collecting ingredients for a recipe. Here, we’re grabbing historical returns and volatility for a bunch of stocks.
To gather stock data, we use the yfinance Python library, enabling us to download the returns of 40 different stocks.
# Define the list of stock tickers you want to analyze
tickers = [
    'AAPL', 'MSFT', 'GOOGL', 'AMZN', 'TSLA', 'META', 'NVDA', 'BRK-B', 'JPM', 'JNJ',
    'V', 'PG', 'UNH', 'DIS', 'PYPL', 'NFLX', 'KO', 'PEP', 'ADBE', 'CSCO', 'INTC', 'IBM', 'ORCL', 'CSX', 'BA', 'XOM', 'CVX', 'T', 'VZ', 'NKE',
    'MCD', 'SBUX', 'WMT', 'HD', 'LOW', 'COST', 'PFE', 'MRK', 'ABBV', 'MDT'
]

# Download historical data for these tickers
data = yf.download(tickers, period='2y')

# Calculate daily returns
daily_returns = data['Adj Close'].pct_change().dropna()

# Calculate annualized returns and volatility
annual_returns = daily_returns.mean() * 252  # Assuming 252 trading days in a year
annual_volatility = daily_returns.std() * np.sqrt(252)

# Create a DataFrame with the computed returns and volatility
stock_data = pd.DataFrame({
    'Stock': annual_returns.index,
    'Returns': annual_returns.values,
    'Volatility': annual_volatility.values
})

# Display the stock data
print(stock_data)

# Prepare features for clustering or further analysis
features = stock_data[['Returns', 'Volatility']]
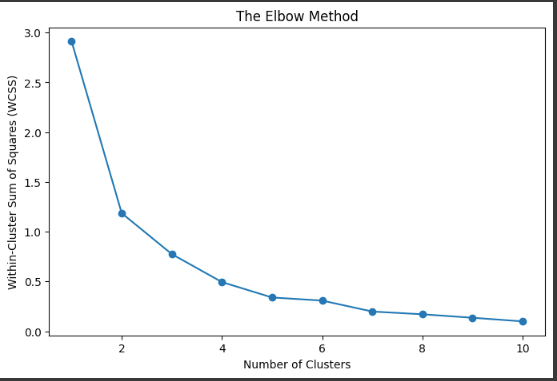
Step 3: Find the Right Number of Groups
Too many clusters, and it’s like sorting socks by shade instead of color — too granular. Too few, and you might as well not sort at all.
wcss = []
for i in range(1, 11):
    kmeans = KMeans(n_clusters=i)
    kmeans.fit(features)
    wcss.append(kmeans.inertia_)

# Plotting the Elbow Method graph
plt.figure(figsize=(8,5))
plt.plot(range(1, 11), wcss, marker='o')
plt.xlabel('Number of Clusters')
plt.ylabel('Within-Cluster Sum of Squares (WCSS)')
plt.title('The Elbow Method')
plt.show()
You’ll look for the “elbow” in the chart — the point where adding another cluster doesn’t significantly improve things.
Step 4: Cluster the Stocks
Let’s say the elbow tells us to go with four clusters.
# Perform KMeans clustering
kmeans = KMeans(n_clusters=4, random_state=42)
stock_data['Cluster'] = kmeans.fit_predict(features)
Step 5: See the Results
Now, let’s peek at how our stocks are grouped.
# Plot clusters
plt.figure(figsize=(10, 6))
plt.scatter(stock_data['Returns'], stock_data['Volatility'], c=stock_data['Cluster'], cmap='viridis')
plt.xlabel('Annualized Returns')
plt.ylabel('Annualized Volatility')
plt.title('Stock Clusters Based on Returns and Volatility')
plt.colorbar(label='Cluster')
plt.show()
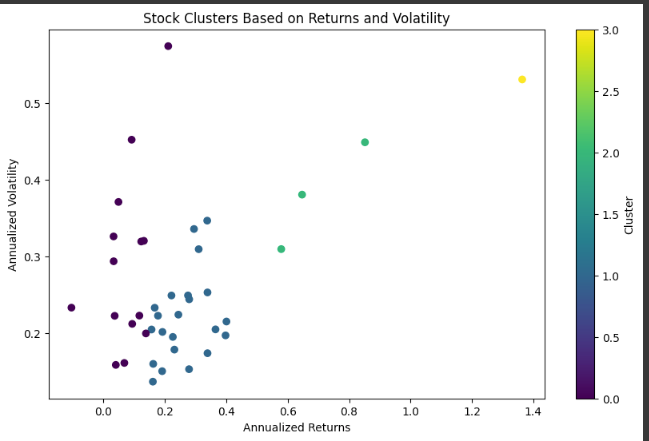
You should see your stocks grouped into clusters — like sorted socks ready to be paired.
Does Diversification Across Clusters Really Help?
Let’s put our clustering to the test. Suppose we want to see how diversifying across different clusters affects our portfolio compared to randomly picking stocks from the same cluster or at random.
We’ll simulate portfolios and compare their maximum drawdowns.
What’s Drawdown?
Drawdown measures the peak-to-trough decline during a specific period. In simple terms, it’s how much your portfolio could fall from its highest value before recovering.
Simulating Portfolios
Let’s create two portfolios:
- Diversified Portfolio: Stocks chosen from different clusters.
- Same Cluster Portfolio: Stocks chosen from the same cluster.
We’ll then simulate their returns over time.
# Function to calculate maximum drawdown
def calculate_max_drawdown(cumulative_returns):
    running_max = np.maximum.accumulate(cumulative_returns)
    drawdowns = (cumulative_returns - running_max) / running_max
    max_drawdown = drawdowns.min()
    return max_drawdown

# Select one stock from each cluster randomly for diversified portfolio
diversified_stocks = stock_data.groupby('Cluster').apply(lambda x: x.sample(1)).reset_index(drop=True)
diversified_returns = daily_returns[diversified_stocks['Stock']]

# Calculate cumulative returns for diversified portfolio
diversified_cum_returns = (1 + diversified_returns).cumprod()

# Calculate max drawdown for diversified portfolio
diversified_max_drawdown = diversified_cum_returns.apply(calculate_max_drawdown)

# Select four stocks from the same cluster randomly
cluster_choice = 0
same_cluster_stocks = stock_data[stock_data['Cluster'] == cluster_choice].sample(4)
same_cluster_returns = daily_returns[same_cluster_stocks['Stock']]

# Calculate cumulative returns for same-cluster portfolio
same_cluster_cum_returns = (1 + same_cluster_returns).cumprod()

# Calculate max drawdown for same-cluster portfolio
same_cluster_max_drawdown = same_cluster_cum_returns.apply(calculate_max_drawdown)

# Print results
print("Diversified Portfolio Max Drawdown:")
for stock, mdd in diversified_max_drawdown.items():
    print(f"{stock}: {mdd:.2%}")

print(f"Average Drawdown:  {diversified_max_drawdown.mean():.2%}")

print("\nSame Cluster Portfolio Max Drawdown:")
for stock, mdd in same_cluster_max_drawdown.items():
    print(f"{stock}: {mdd:.2%}")

print(f"Average Drawdown:  {same_cluster_max_drawdown.mean():.2%}")

# Compare differences
difference = diversified_max_drawdown.mean() - same_cluster_max_drawdown.mean()
print(f"\nDifference in average max drawdown: {difference:.2%}")def max_drawdown(portfolio):
    cumulative_max = np.maximum.accumulate(portfolio)
    drawdowns = (portfolio - cumulative_max) / cumulative_max
    return drawdowns.min()

diversified_drawdown = max_drawdown(diversified_portfolio)
same_cluster_drawdown = max_drawdown(same_cluster_portfolio)
random_drawdown = max_drawdown(random_portfolio)

print(f"Diversified Portfolio Max Drawdown: {diversified_drawdown:.2%}")
print(f"Same Cluster Portfolio Max Drawdown: {same_cluster_drawdown:.2%}")
print(f"Random Portfolio Max Drawdown: {random_drawdown:.2%}")
Comparing the Results
Let’s see how these portfolios performed over the year.
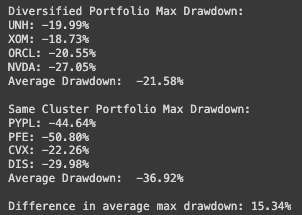
"Diversified Portfolio Max Drawdown": -21.58%
"Same Cluster Portfolio Max Drawdown": -36.92%

"Difference in average max drawdown": 15.34%
The Exaggerated Impact of Diversification
In our example, the Diversified Portfolio had a maximum drawdown of 22%, while the Same Cluster Portfolio suffered a whopping 37% decline.
That’s a significant difference. By choosing stocks from different clusters, we mitigated the risk of a severe downturn.
Why Such a Big Difference?
When you pick stocks from the same cluster, they’re more likely to move together. If one stock drops, the others might follow suit — like dominoes. Diversifying across clusters means your stocks are less correlated; they respond differently to market events.
If you’re interested in investing in stocks within the same group, consider using the pair trading strategy. We’ve discussed this approach in detail in our previous blogs, which you can explore here.
Turning Data into Decisions
So, what does this mean for you?
- Risk Management: Diversifying across different clusters can protect your portfolio from extreme losses.
- Informed Choices: Clustering helps you understand the underlying similarities and differences between stocks.
- Peace of Mind: Knowing that your portfolio isn’t overly exposed to a single type of stock or market movement can help you sleep better at night.
The Human Side of Investing
Behind every data point is a story. Companies are run by people, influenced by markets, and affected by events we can’t predict.
Clustering helps us manage the data avalanche, but it doesn’t replace understanding a company’s fundamentals or the emotions driving market behavior.
Remember when toilet paper flew off the shelves in 2020? It wasn’t because people suddenly needed more — it was fear and herd behavior. Stocks can behave the same way.
Finding Your Own Path
Investing isn’t about copying someone else’s strategy. It’s about finding what works for you. Tools like K-Means Clustering are just that — tools. They help you craft your approach.
Maybe you prefer diving deep into a company’s annual reports. Or perhaps you rely on trends and charts. There’s no one-size-fits-all, and that’s okay.
Wrapping Up
Next time you’re faced with too many choices — whether it’s stocks, pasta sauce, or what to watch tonight — remember that grouping can bring clarity.
By breaking down complex options into manageable categories, we can make decisions with more confidence and less stress.
Investing doesn’t have to be a labyrinth. Sometimes, it’s as simple as sorting socks.
Additional Resources
We also offer a variety of free indicators and a premium indicator available for trial at no cost.
If you appreciate our strategy and insights, please help us grow by following our page and trying out our indicators.
To discover more about TradeDots, please glance through our comprehensive documentation with the link below: https://docs.tradedots.xyz/
🖥️ Get TradeDots Indicator: https://bit.ly/tradedots
📈 [Download] High Growth Alpha Stock List: https://bit.ly/tradedots-alphalist
📃 [Download] 2024 Forex Trading Journal: https://bit.ly/2024-trading-journal
Stay connected for more insightful blogs and updates, and join our telegram community for free trading ideas and stock watch alerts.
Twitter: https://twitter.com/tradedots
YouTube: https://youtube.com/@tradedots/
Telegram: https://t.me/tradedots_official
About TradeDots
TradeDots is a TradingView indicator that identifies market reversal patterns through the implementation of quantitative trading algorithm on price actions. Try our 7-day FREE Trial to level up your trading game.
Join us now to experience TradeDots across all trading assets!
Disclaimer: This article is for informational purposes only and does not constitute financial advice. Investing involves risks, and it’s important to conduct your own research or consult with a financial professional before making investment decisions.

