


.png)


Remember our last chat about pair trading? We compared investing to a teeter-totter, trying to find that sweet equilibrium.
In the technology sector, Apple and Microsoft share a similar relationship. They’ve competed, collaborated, and grown together over decades.
In this blog, we’ll explore how to use Python to check if any two stocks are not just competitors but also statistically connected through a concept called cointegration.
Don’t worry if you’re not a programming expert. We’ll walk through each step like old friends catching up over coffee. By the end, you’ll see how a bit of code can help uncover potential opportunities in the stock market.
Why Cointegration Matters in Pair Trading
Let’s revisit the essence of cointegration.
In investing, it’s not uncommon to find stocks that seem to move together. But how do we determine if their relationship is meaningful or just coincidental? Cointegration helps us understand whether two stocks have a long-term equilibrium despite short-term deviations.
Think of Apple and Microsoft as two marathon runners. They might not run side by side the entire race, but over the long haul, they keep a similar pace, sometimes one pulling ahead, then the other, but neither straying too far.
By identifying such relationships, we can potentially spot when one stock has moved away from its partner more than usual, presenting a trading opportunity.
A Step-by-Step Guide to Checking Cointegration with Python
Ready to build your own analysis program? Let’s explore how you can use Python to test for cointegration between Apple and Microsoft over the past 15 years.
1. Setting Up Your Environment
First, ensure you have Python installed on your computer. We’ll use a few libraries to help with our analysis:
- pandas for data manipulation
- matplotlib for plotting
- statsmodels for statistical tests
- yfinance for fetching stock data
- datetime and dateutil for handling dates
Installing Libraries
If you haven’t already, install these libraries using pip:
pip install pandas matplotlib statsmodels yfinance python-dateutil
Now, let’s import them in our Python script:
import pandas as pd
import matplotlib.pyplot as plt
import statsmodels.api as sm
import yfinance as yf
from datetime import datetime
from dateutil.relativedelta import relativedelta
2. Choosing Our Stocks: Apple and Microsoft
We’ll focus on Apple Inc. ($AAPL) and Microsoft Corporation ($MSFT), two leaders in the tech industry with a rich history of competition and innovation.
# Define the stock symbols
stock1 = 'AAPL'  # Apple Inc.
stock2 = 'MSFT'  # Microsoft Corporation
3. Fetching Historical Stock Data
We’ll gather historical closing prices for the past 15 years, starting from 15 years ago up to today’s date.
# Define the time period

# Get today's date
end_date = datetime.today().date()

# Calculate the date 15 years ago
start_date = end_date - relativedelta(years=15)

# Fetch the data using yfinance
data1 = yf.download(stock1, start=start_date, end=end_date)
data2 = yf.download(stock2, start=start_date, end=end_date)

# Create a DataFrame with closing prices
df = pd.DataFrame()
df[stock1] = data1['Close']
df[stock2] = data2['Close']
4. Visualizing the Stock Prices
Let’s plot the closing prices to observe how these two stocks have moved over time.
# Plot the closing prices
plt.figure(figsize=(12,6))
plt.plot(df[stock1], label=stock1)
plt.plot(df[stock2], label=stock2)
plt.title('Closing Prices of Apple and Microsoft (Last 15 Years)')
plt.xlabel('Date')
plt.ylabel('Price ($)')
plt.legend()
plt.show()
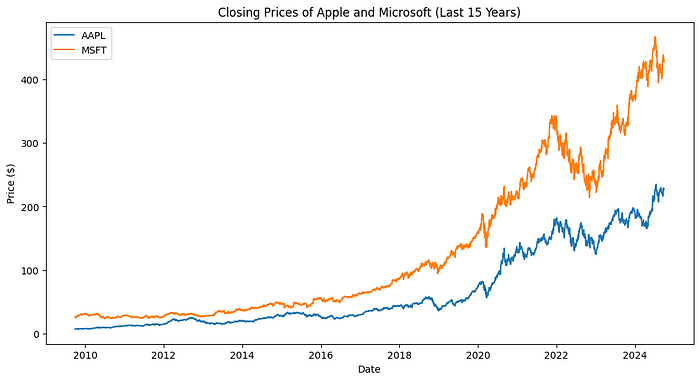
Observation: Notice how both stocks have shown significant growth, often moving in similar directions. This visual gives us an initial sense of their relationship.
5. Testing for Stationarity
Before testing for cointegration, we need to check if the individual stock price series are stationary.
We’ll use the Augmented Dickey-Fuller (ADF) test.
from statsmodels.tsa.stattools import adfuller

# Function to perform ADF test
def adf_test(series, title=''):
    print(f'Augmented Dickey-Fuller Test: {title}')
    result = adfuller(series.dropna())
    labels = ['Test Statistic', 'p-value', '#Lags Used', 'Number of Observations Used']
    for value, label in zip(result, labels):
        print(f'{label}: {value}')
    if result[1] <= 0.05:
        print("The series is likely stationary.")
    else:
        print("The series is likely non-stationary.")
    print('')

# Test both stocks
adf_test(df[stock1], title=stock1)
adf_test(df[stock2], title=stock2)
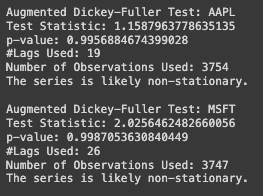
Interpreting the Results:
- If the p-value <= 0.05, the series is likely stationary.
- If the p-value > 0.05, the series is likely non-stationary.
Typically, stock prices are non-stationary, which means they have trends over time. This is acceptable for our analysis since we’re interested in the cointegration of non-stationary series.
6. Conducting the Cointegration Test
Now, let’s test whether Apple’s and Microsoft’s stock prices are cointegrated.
from statsmodels.tsa.stattools import coint

# Perform the cointegration test
coint_result = coint(df[stock1], df[stock2])

# Extract the p-value
p_value = coint_result[1]

print(f'Cointegration test p-value: {p_value}')

Understanding the Outcome:
- p-value <= 0.05: There is statistical evidence of cointegration.
- p-value > 0.05: No statistical evidence of cointegration.
If the p-value is less than or equal to 0.05, we can consider Apple and Microsoft to be cointegrated over the past 15 years.
7. Analyzing the Spread
Assuming they are cointegrated, let’s examine the spread between their stock prices.
First, we need to establish the optimal hedge ratio, which represents the long-term equilibrium relationship between the two stocks. We’ll use linear regression for this.
# Perform linear regression to find the hedge ratio
X = sm.add_constant(df[stock2])
model = sm.OLS(df[stock1], X).fit()
hedge_ratio = model.params[stock2]
print(f'Hedge Ratio: {hedge_ratio}')

Now, calculate the spread:
# Calculate the spread
df['Spread'] = df[stock1] - hedge_ratio * df[stock2]

# Plot the spread
plt.figure(figsize=(12,6))
plt.plot(df['Spread'], label='Spread')
plt.axhline(df['Spread'].mean(), color='red', linestyle='--', label='Mean')
plt.title('Spread Between Apple and Microsoft')
plt.xlabel('Date')
plt.ylabel('Spread ($)')
plt.legend()
plt.show()
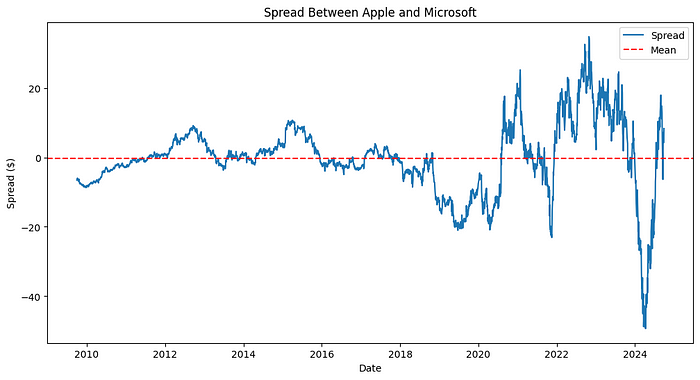
Observation: If the spread fluctuates around a constant mean and doesn’t drift over time, it further supports the cointegration.
8. Testing the Stationarity of the Spread
To confirm cointegration, the spread itself should be stationary. Let’s perform the ADF test on the spread.
# ADF test on the spread
adf_test(df['Spread'], title='Spread')
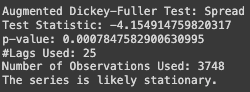
If the spread is stationary (p-value <= 0.05), it strengthens the evidence of cointegration.
9. Interpreting the Results
- Cointegration Confirmed: If both the cointegration test and the stationarity test on the spread support cointegration, Apple and Microsoft share a long-term equilibrium relationship.
- Trading Opportunity: Deviations from the mean spread can indicate potential trading opportunities. When the spread widens or narrows beyond historical levels, it might revert back, allowing for potential profits.
Reflecting on the Journey
Isn’t it fascinating how two tech giants, after years of rivalry and innovation, still exhibit a statistical relationship?
This exercise isn’t just about numbers and code. It’s about understanding the stories behind these companies — their growth, challenges, and the industry forces that tie them together.
By leveraging Python, we’ve peeled back a layer of the market, revealing patterns that might not be immediately apparent.
Practical Takeaways
- Cointegration Reveals Deep Relationships: It’s more than just correlation; it’s about a shared path over time.
- Python Makes Analysis Accessible: Even with basic programming skills, you can perform sophisticated financial analyses.
- Stay Inquisitive: Markets are complex and ever-changing. A curious mind is one of the best tools you have.
A Balanced Perspective
While our analysis suggests a cointegration between Apple and Microsoft over the past 15 years, it’s essential to approach this with caution.
- Market Conditions Change: Past relationships don’t guarantee future ones. Technological shifts, market disruptions, or company-specific events can alter dynamics.
- Risk Management is Critical: Always consider potential risks, and don’t rely solely on statistical tests.
- Holistic Approach: Combine technical analysis with fundamental research on the companies involved.
Closing Thoughts
Investing is as much an art as it is a science. While tools like Python and statistical tests provide valuable insights, they are most powerful when combined with an understanding of the broader narratives at play.
Apple and Microsoft aren’t just stock symbols; they’re reflections of innovation, competition, and collaboration in the tech world.
By embracing both the quantitative and qualitative aspects of investing, we position ourselves to make more informed and thoughtful decisions.
So next time you’re considering your investment strategy, remember our walk through cointegration. Perhaps, like those two experienced chess players, you’ll see moves and patterns others might miss.
Additional Resources
We also offer a variety of free indicators and a premium indicator available for trial at no cost.
If you appreciate our strategy and insights, please help us grow by following our page and trying out our indicators.
To discover more about TradeDots, please glance through our comprehensive documentation with the link below: https://docs.tradedots.xyz/
🖥️ Get TradeDots Indicator: https://bit.ly/tradedots
📈 [Download] High Growth Alpha Stock List: https://bit.ly/tradedots-alphalist
📃 [Download] 2024 Forex Trading Journal: https://bit.ly/2024-trading-journal
Stay connected for more insightful blogs and updates, and join our telegram community for free trading ideas and stock watch alerts.
Twitter: https://twitter.com/tradedots
YouTube: https://youtube.com/@tradedots/
Telegram: https://t.me/tradedots_official
About TradeDots
TradeDots is a TradingView indicator that identifies market reversal patterns through the implementation of quantitative trading algorithm on price actions. Try our 7-day FREE Trial to level up your trading game.
Join us now to experience TradeDots across all trading assets!
Disclaimer: This article is for informational purposes only and does not constitute financial advice. Investing involves risks, and it’s important to conduct your own research or consult with a financial professional before making investment decisions.

