


.png)


Imagine you’re planning a cross-country road trip. You’ve got the perfect playlist, snacks for days, and an open calendar. The excitement of the journey ahead is palpable.
But before you hit the open road, you’d probably check your car’s oil, inspect the tires, and maybe even map out your route. Skipping these steps might add a thrill, but it could also leave you stranded in the middle of nowhere.
Investing isn’t much different. We often get excited about a new trading strategy that promises great returns. But jumping in without testing it first? That’s like driving a car without brakes — you might go fast for a while, but the outcome likely won’t be pleasant.
I’ve been there myself. The allure of quick gains can cloud the judgment of even the most disciplined among us. But over time, I’ve learned that taking a moment to test and understand your strategy can make all the difference. It’s not just about avoiding pitfalls; it’s about knowing the road ahead.
So let’s talk about backtesting. It’s like a test drive for your trading strategy, using historical data to see how it would have performed. And thanks to Python, it’s a tool that’s accessible to anyone willing to spend a little time learning. And with tools like Backtesting.py, the process has become more accessible than ever.
Why Test Drive Your Trading Strategy?
When I was a kid, my grandpa told me, “Measure twice, cut once.” At the time, I thought it was just about woodworking. Now, I realize it’s a lesson about preparation in all aspects of life.
A Simple Strategy Worth Testing
Think about cooking for a moment. Before serving a new recipe to guests, you’d probably try it out first, right? Maybe adjust the seasoning, tweak the cooking time. Trading strategies deserve the same thoughtful experimentation.
One of the simplest strategies to start with is the Moving Average Crossover.
The Moving Average Crossover Explained
- Short-Term Average (Fast): Reflects recent price movements.
- Long-Term Average (Slow): Smooths out long-term trends.
- Buy Signal: When the short-term average crosses above the long-term average.
- Sell Signal: When the short-term average crosses below the long-term average.
It’s like watching the seasons change. When flowers start blooming (short-term average rises), it’s a sign of spring (potential uptrend). When the leaves fall (short-term average falls), winter may be coming (potential downtrend).
Getting Started with Python
You might be thinking, “I’m not a programmer. Can I really do this?” The good news is, Python is user-friendly, so it’s easy to follow even if you are not a computer guy.
Tools You’ll Need
- Python: The language we’ll use.
- pandas: For data manipulation.
- yfinance: To download historical stock data.
- Backtesting.py: A Python framework for testing trading strategies
- numpy: A package for scientific computing with Python
If you’ve ever followed a recipe, you can follow along here.
Step-by-Step Guide to Backtesting
Step 1: Install the Necessary Libraries
First things first, we’ll need to install Backtesting.py and a few other libraries.
pip install backtesting yfinance numpy pandas
Step 2: Import Libraries and Fetch Data
First, we’ll set up our workspace.
from backtesting import Backtest, Strategy
from backtesting.test import SMA
from backtesting.lib import crossover
import pandas as pd
import yfinance as yf
import numpy as np
Let’s choose an asset to test. How about the Apple Stock (AAPL)? It’s like testing a recipe with chicken — versatile and widely used.
# Fetch data
data = yf.download('AAPL', start='2014-10-09', end='2024-10-08')

# Prepare data
data = data[['Open', 'High', 'Low', 'Close', 'Volume']]
data.columns = ['Open', 'High', 'Low', 'Close', 'Volume']
Step 3: Define the Strategy
Here’s where Backtesting.py shines. We define a strategy by creating a subclass of Strategy.
# Define the SMA Crossover Strategy
class SMACrossover(Strategy):
    # Define parameters
    n1 = 10  # Fast SMA
    n2 = 20  # Slow SMA

    def init(self):
        # Calculate SMAs
        close = self.data.Close
        self.sma1 = self.I(SMA, close, self.n1)
        self.sma2 = self.I(SMA, close, self.n2)

    def next(self):
        # If fast SMA crosses above slow SMA
        if crossover(self.sma1, self.sma2):
            self.buy()

        # If fast SMA crosses below slow SMA
        elif crossover(self.sma2, self.sma1):
            self.sell()
Let’s break it down:
- init(): Runs once at the start. We calculate the short-term and long-term moving averages.
- next(): Runs on each data point. We check for crossover signals to buy or sell.
Step 4: Run the Backtest
# Create and run the backtest
bt = Backtest(data, SMACrossover, cash=10000, commission=.002, exclusive_orders=True)
stats = bt.run()
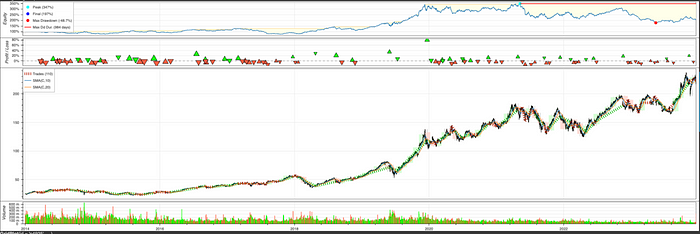
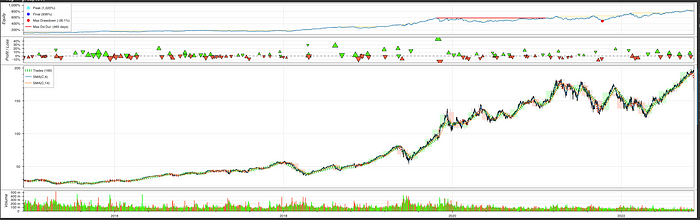
This will display a detailed report and an interactive chart showing how the strategy performed.
P.S. Assume $10,000 initial capital with 0.2% commission per trade.
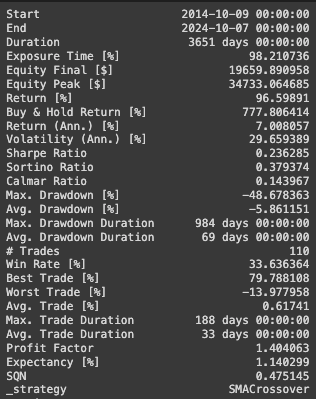
Step 5: Review the Results
After running the backtest, you get a wealth of information
# Print the backtest results
print(stats)

# Plot the backtest results
bt.plot()
Key Metrics to Look At:
- Return [%]: Overall percentage return.
- Sharpe Ratio: Risk-adjusted return.
- Max. Drawdown [%]: Largest peak-to-trough decline.
Optimizing the Strategy
Remember how a recipe might call for “salt to taste”? Similarly, we can adjust the moving average windows to see if there’s a better combination.
Step 1: Define Optimization Parameters
We can tell Backtesting.py which parameters to optimize.
def optimize_sma():
# Run optimization
optimization_results = bt.optimize(
n1=range(2, 52, 2), # Fast SMA from 2 to 50, step 2
n2=range(10, 202, 2), # Slow SMA from 10 to 202, step 2
maximize='Sharpe Ratio', # Maximize Sharpe Ratio
constraint=lambda p: p.n1 < p.n2 # Ensure fast SMA is shorter than slow SMA
)
# Print optimization results
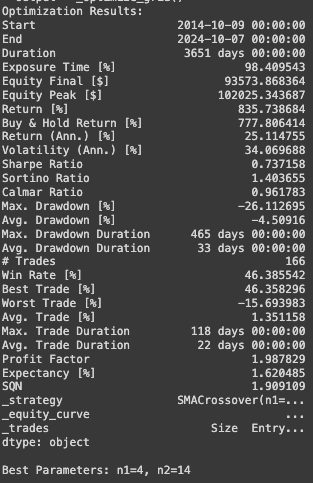
print("Optimization Results:")
print(optimization_results)
# Get the best parameters
best_n1 = optimization_results._strategy.n1
best_n2 = optimization_results._strategy.n2
print(f"\nBest Parameters: n1={best_n1}, n2={best_n2}")
# Run the backtest with the best parameters
best_run = bt.run(n1=best_n1, n2=best_n2)
# Print the results of the best run
print("\nBest Run Results:")
print(best_run)
# Plot the results of the best run
bt.plot()
Step 2: Run the Optimization
# Run the optimization
optimize_sma()
Backtesting.py will try different combinations and find the ones that maximize the Sharpe Ratio.
Step 3: Review Optimized Results
You’ll see which combination of short_window and long_window performed best.
Thinking Beyond the Numbers
It’s easy to get caught up in optimizing for the best returns. But remember, higher returns often come with higher risks.
The Human Side of Trading
- Emotional Resilience: Can you stick with a strategy during drawdowns?
- Personal Circumstances: Your financial goals and risk tolerance matter.
- Behavioral Biases: We’re not always rational. Fear and greed can cloud judgment.
When I first started investing, I thought I could outsmart the markets by constantly tweaking my strategies. What I learned is that discipline often trumps brilliance.
The Limitations of Backtesting
- Past Performance Isn’t Future Performance: Markets change. A strategy that worked in the past may not work tomorrow.
- Overfitting: Optimizing too much can lead to a strategy that only works on historical data.
- Ignoring Costs: Real-world factors like taxes, slippage, and transaction fees can erode returns.
Practical Takeaways
- Start Simple: Don’t overcomplicate your strategies. Simple doesn’t mean ineffective.
- Test Thoroughly: Use tools like Backtesting.py to understand how your strategy performs under various conditions.
- Stay Informed: Markets evolve. Keep learning and adapting.
- Manage Risk: Always consider the downside. Preserve your capital.
Final Thoughts
Taking the time to backtest is like taking precautions before that big road trip. It doesn’t guarantee smooth sailing, but it significantly reduces the chances of unexpected breakdowns.
Investing is deeply personal. What’s right for someone else might not be right for you. Use tools and strategies as guides, but always align them with your own goals and comfort levels.
At the end of the day, investing isn’t just about numbers — it’s about aligning your money with your life’s journey. So buckle up, plan carefully, and enjoy the ride.
Additional Resources
We also offer a variety of free indicators and a premium indicator available for trial at no cost.
If you appreciate our strategy and insights, please help us grow by following our page and trying out our indicators.
To discover more about TradeDots, please glance through our comprehensive documentation with the link below: https://docs.tradedots.xyz/
🖥️ Get TradeDots Indicator: https://bit.ly/tradedots
📈 [Download] High Growth Alpha Stock List: https://bit.ly/tradedots-alphalist
📃 [Download] 2024 Forex Trading Journal: https://bit.ly/2024-trading-journal
Stay connected for more insightful blogs and updates, and join our telegram community for free trading ideas and stock watch alerts.
Twitter: https://twitter.com/tradedots
YouTube: https://youtube.com/@tradedots/
Telegram: https://t.me/tradedots_official
About TradeDots
TradeDots is a TradingView indicator that identifies market reversal patterns through the implementation of quantitative trading algorithm on price actions. Try our 7-day FREE Trial to level up your trading game.
Join us now to experience TradeDots across all trading assets!
Disclaimer: This article is for informational purposes only and does not constitute financial advice. Investing involves risks, and it’s important to conduct your own research or consult with a financial professional before making investment decisions.

